






Schmitz Cargobull Zaragoza: its AGV line, coordinated from a single server
Custom software that assigns an AGV to each semi-trailer, shows the line on a tablet at every station and takes its data to the plant’s Power BI.
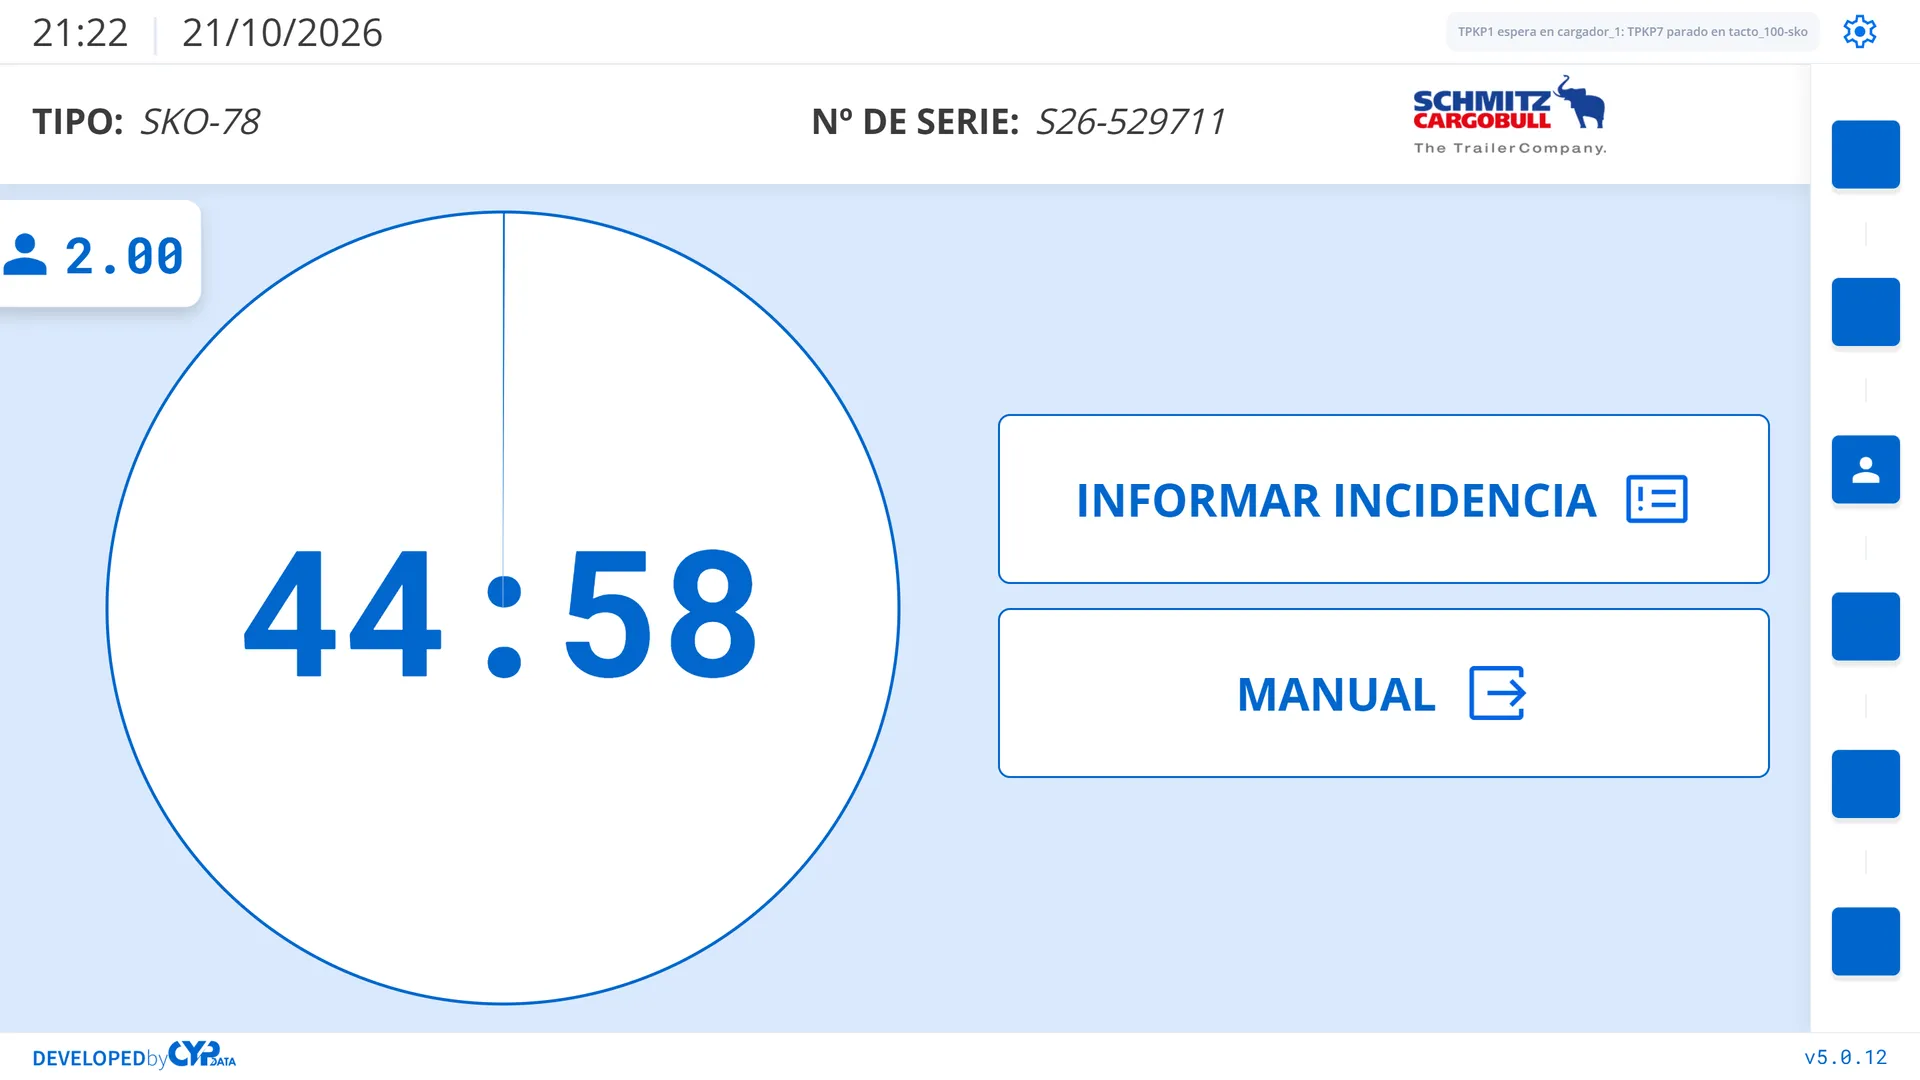
- 0.0 s · Station 300 with its semi-trailer: type, serial number, two people and the time it has left.
- 0.7 s · The camera moves in on the time circle.
- 2.9 s · The camera returns to the whole tablet.
- 3.7 s · You open the station bar: all six, in progress.
- 6.4 s · You close it again.
- Client
- Schmitz Cargobull
- Plant
- Zaragoza
- Sector
- Automotive
- Status
- In production since 2024
- Platforms
- Tablet · Desktop
- Services
- Plant control software
The result
- The server decides what each AGV does: pick up, drop, wait, park or charge
- Every station visit in 5 times, where there used to be one total
- All the data since 2024, in the Power BI the plant uses
- 7 AGVs working the line at once Schmitz Cargobull · Zaragoza Project sheet and server code, CYP DATA, 2026
- 6 stations, each with its own tablet Schmitz Cargobull · Zaragoza Project sheet and server code, CYP DATA, 2026
The challenge
Decide at every moment which AGV moves each semi-trailer, with no collisions or deadlocks on the lane, and let every operator see what is happening.
- One lane, one direction: AGVs cannot overtake
- Warn people before an AGV arrives to collect
- Know where each station’s time goes, not just the total
What it does
Moving each semi-trailer on its AGV
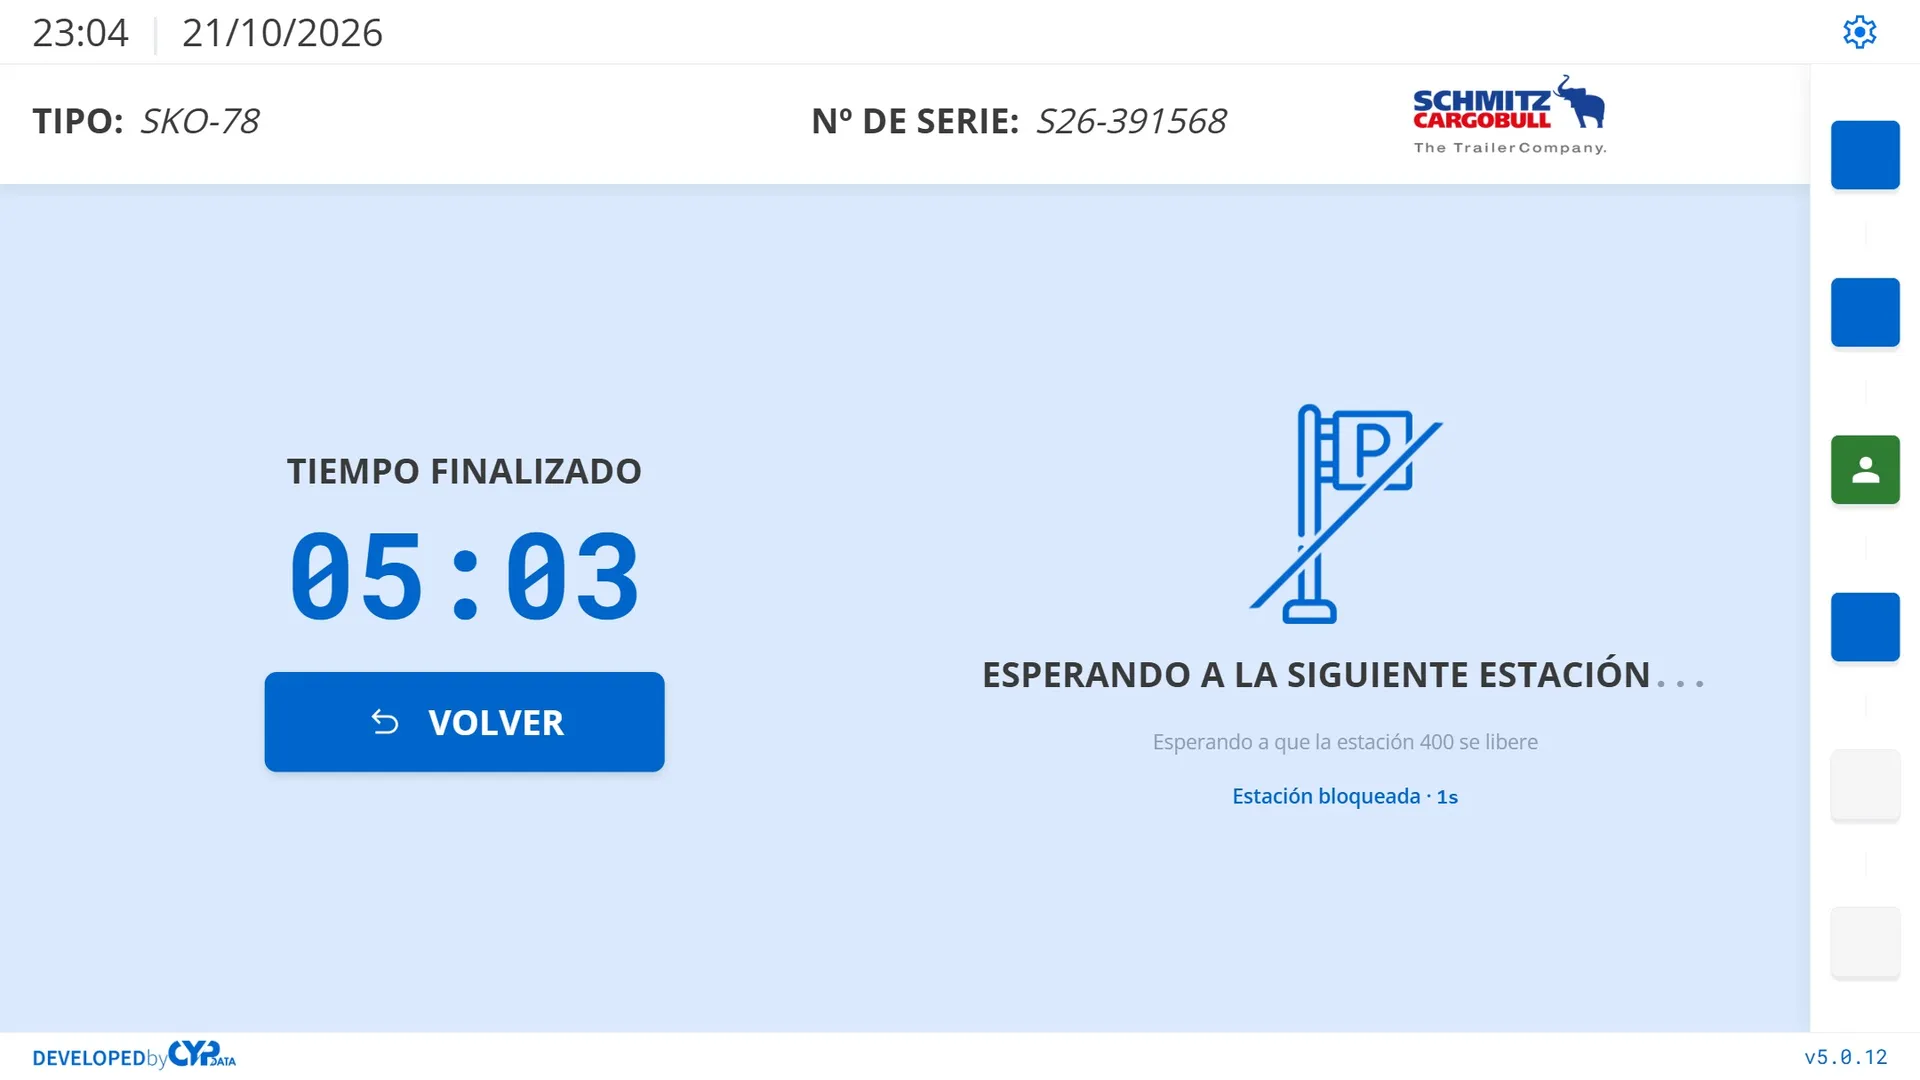
- 0.0 s · Station 300 in manual mode, with 40:00 to go.
- 0.9 s · You tap «FINALIZAR».
- 1.1 s · «AGV DISPONIBLE», with the station's AGV and the node where it waits; the camera moves in on the notice.
- 2.9 s · You tap «CONFIRMAR».
- 3.4 s · «ESPERANDO A LA SIGUIENTE ESTACIÓN»: the mission waits for station 400 to free up, with the blocked-station counter; the camera shows the station's time and the wait.
- 7.2 s · At station 400, «FINALIZAR» is tapped (off camera).
- 8.7 s · «AGV en camino», from station 300 to 400.
- 9.5 s · The tablet waits for the next semi-trailer.
The server picks the AGV and holds the mission until the next station is free; the tablet says what happens.
Reporting an incident
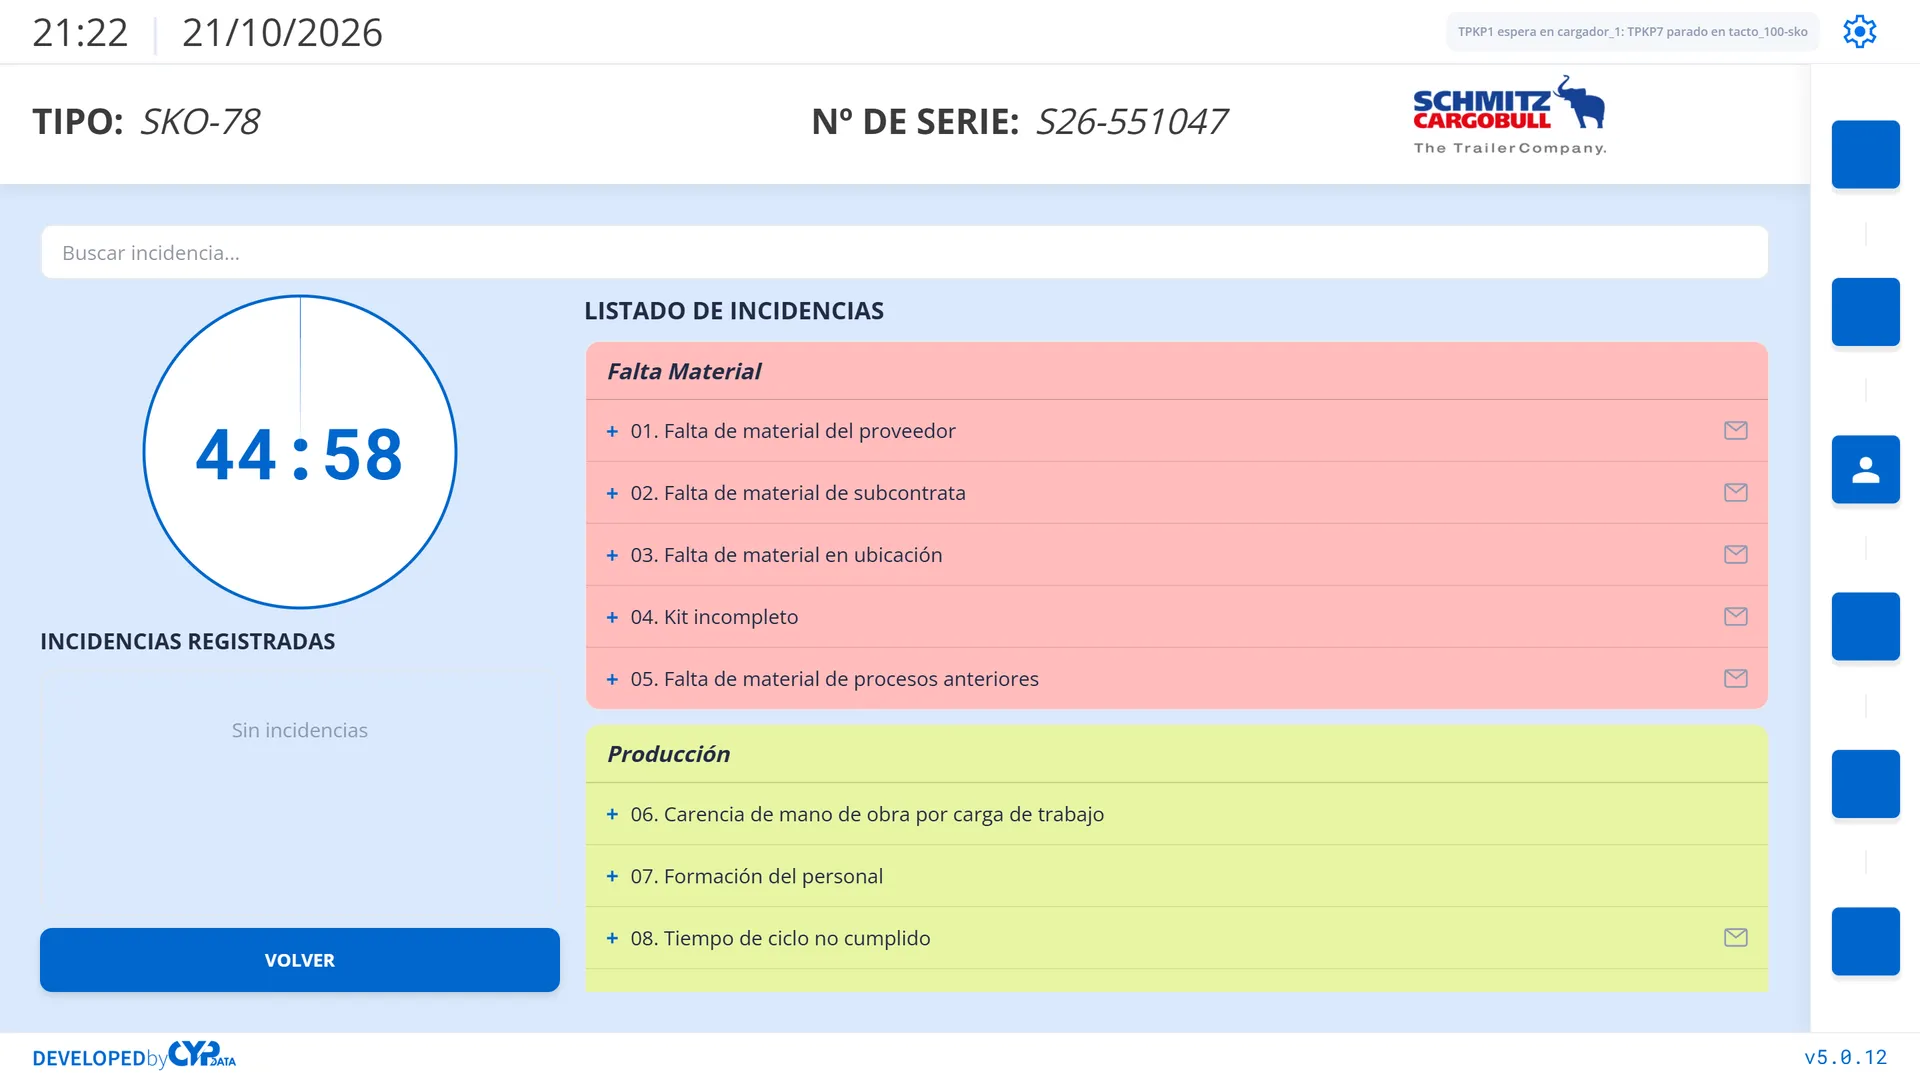
- 1.0 s · You tap «INFORMAR INCIDENCIA»: the list, in coloured groups.
- 2.4 s · You scroll the list to «Instalaciones y Herramienta».
- 4.8 s · You pick «Avería de herramienta», a tool breakdown.
- 6.0 s · You tap the comment «Herramienta rota», broken tool.
- 7.1 s · You tap «CONFIRMAR»: the incident is recorded.
The operator picks the incident from a catalogue by group; if it carries a notice, the right department gets an email.
Following the AGV fleet
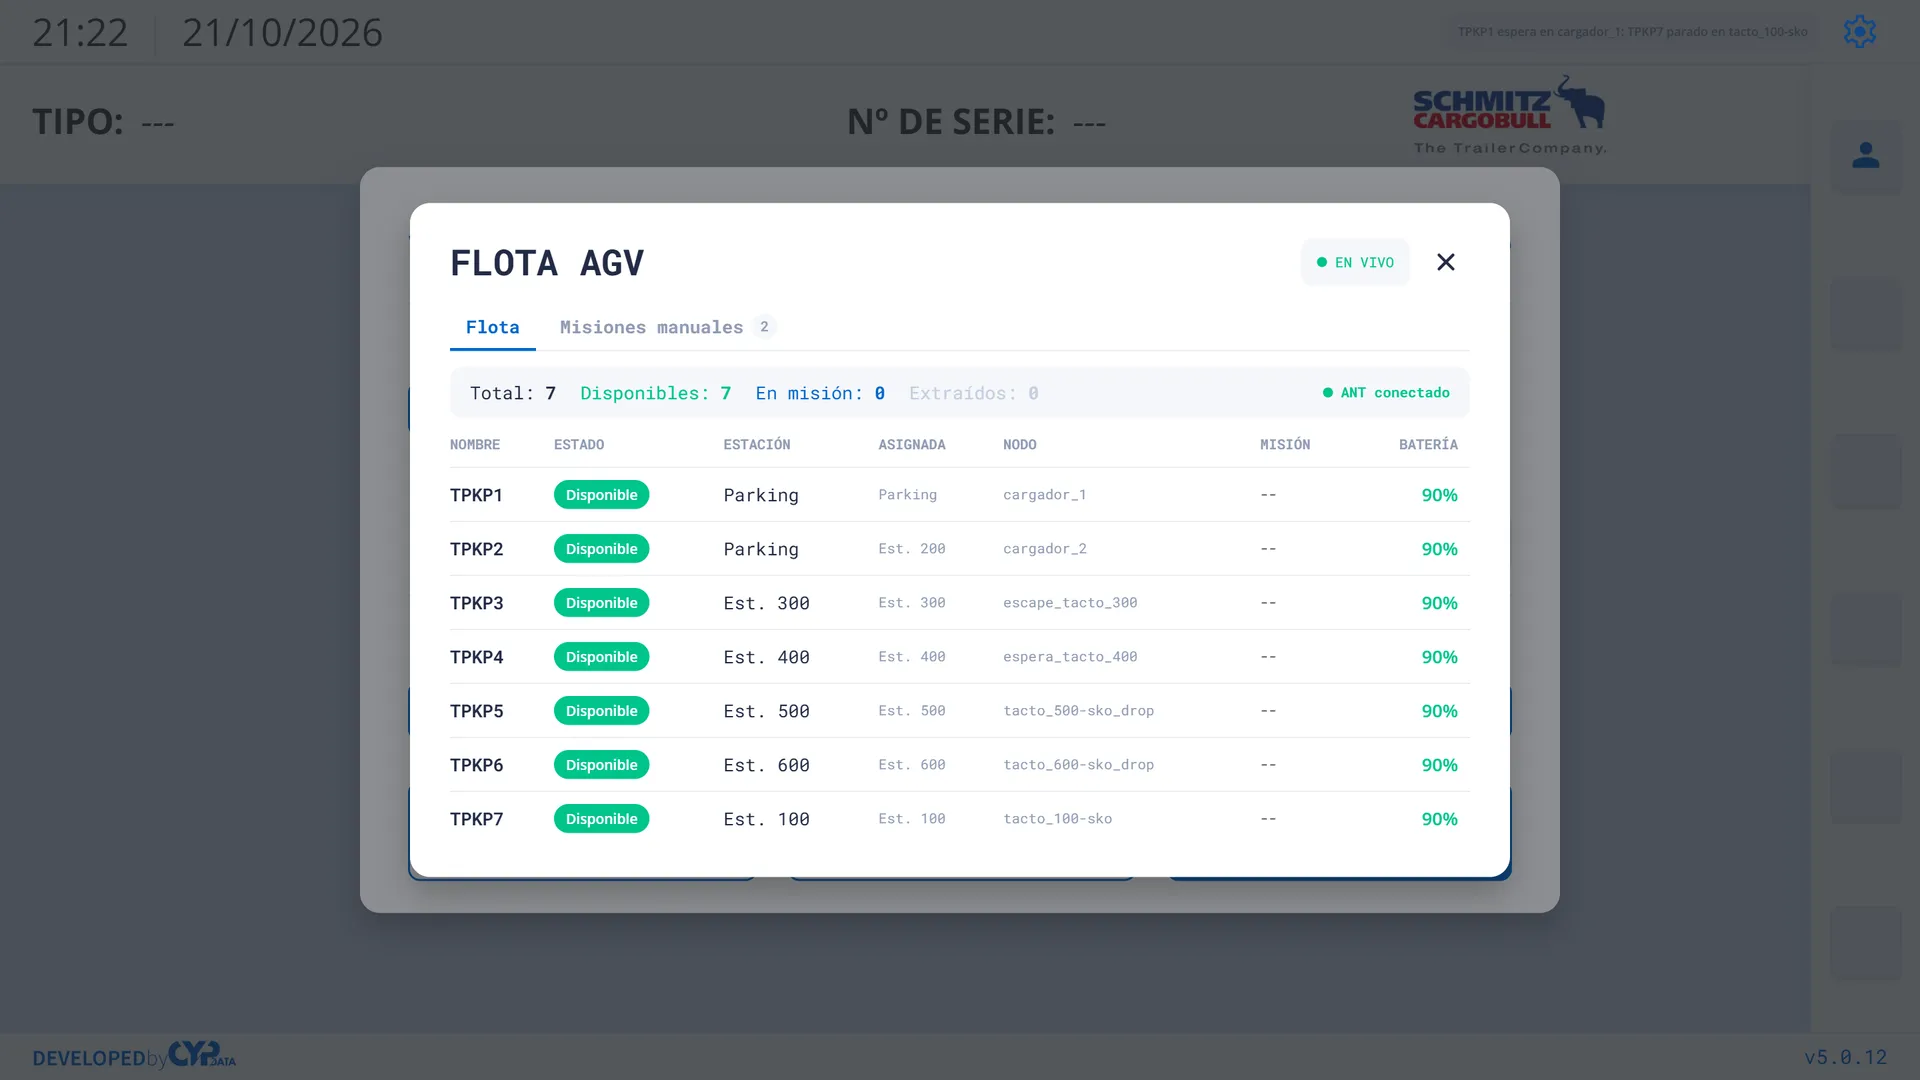
- 0.0 s · The «FLOTA AGV» window, with the seven AGVs.
- 0.9 s · The camera moves in on the rows: state, station, node, mission and battery.
- 3.5 s · The camera returns to the whole window.
- 4.2 s · You switch to «Misiones manuales».
- 6.3 s · You go back to «Flota».
Every AGV live: where it is, which mission it is on and how much battery it has left.
Seeing the line from the shop floor
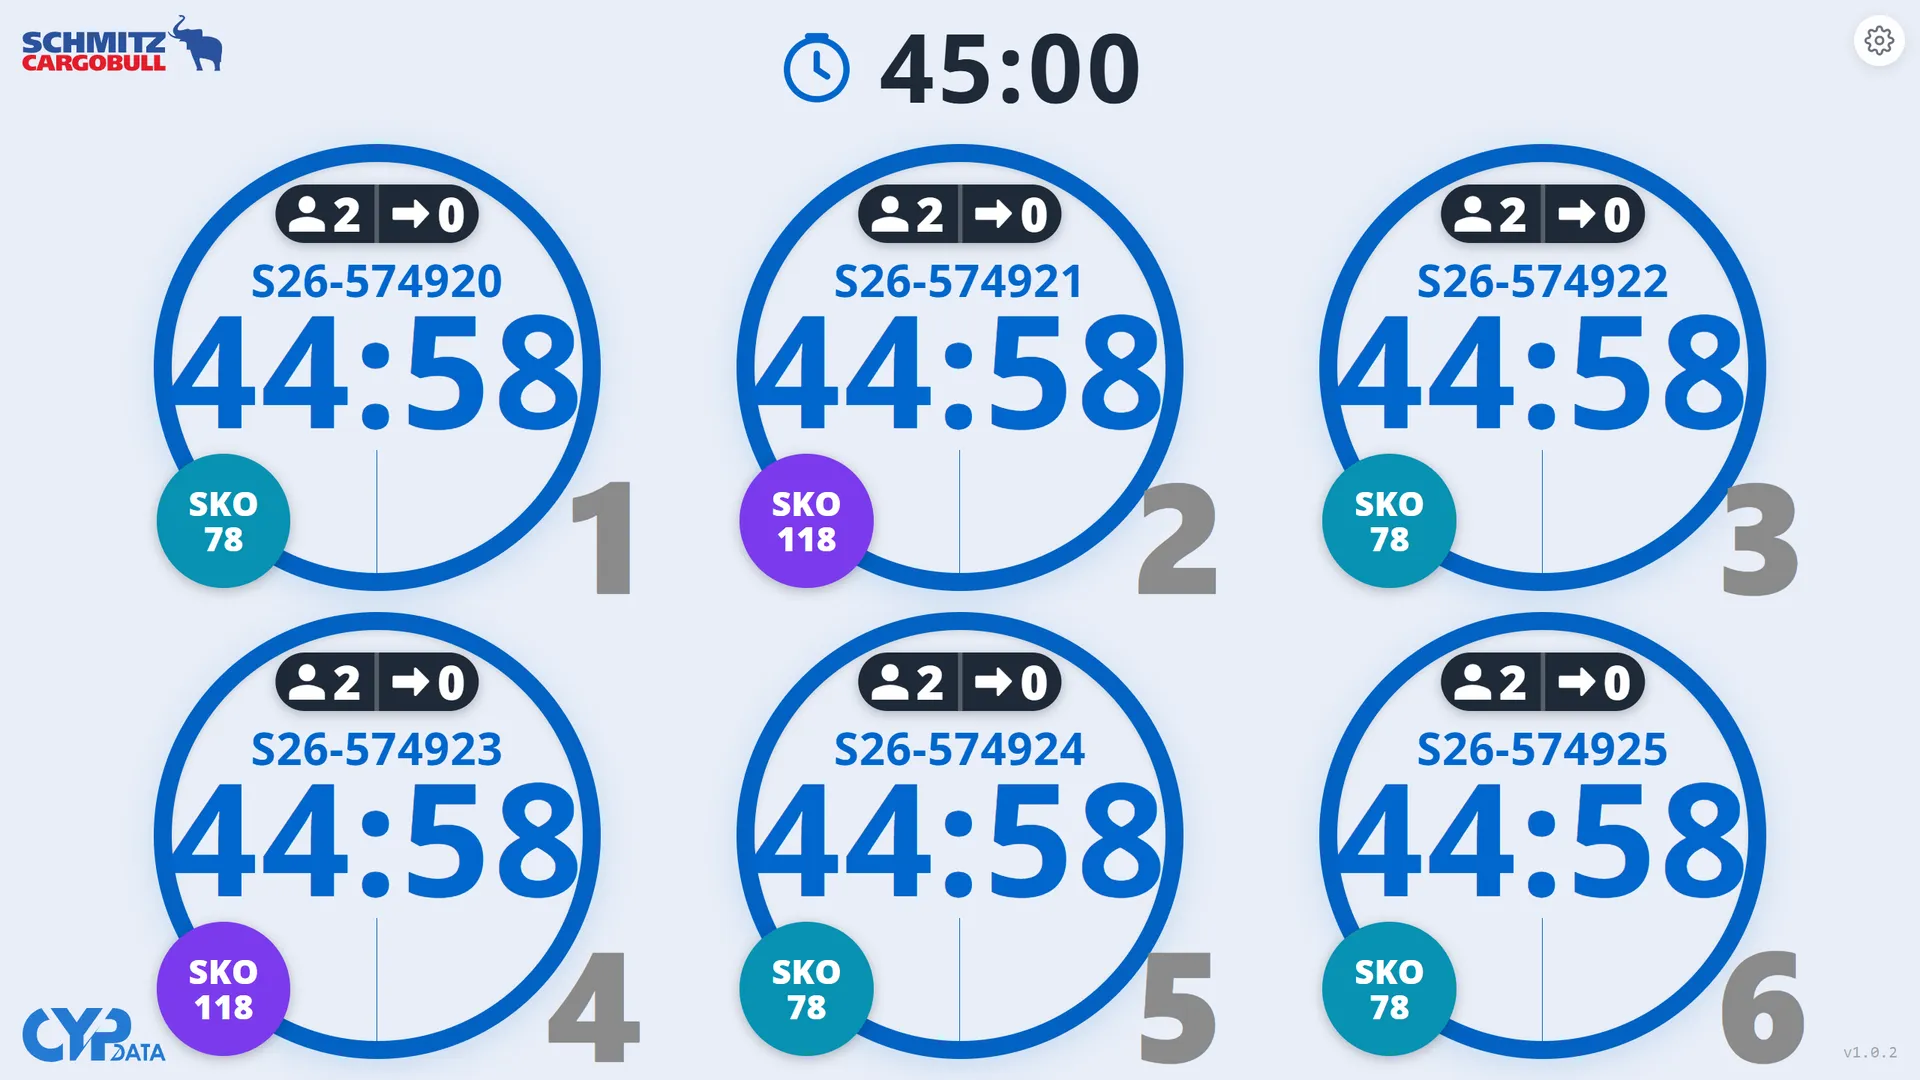
- 0.0 s · The six stations count down their time, with two people at each.
- 1.2 s · The camera moves in on stations 1 and 2.
- 5.0 s · The camera returns to the whole line.
A screen on the shop floor shows every station at once, with the time each one has left.
The line’s data
We designed its Azure SQL database in 2024; in 2026 we renewed the server and the data stayed where it was. The plant’s Power BI reads all of it.
Line overview
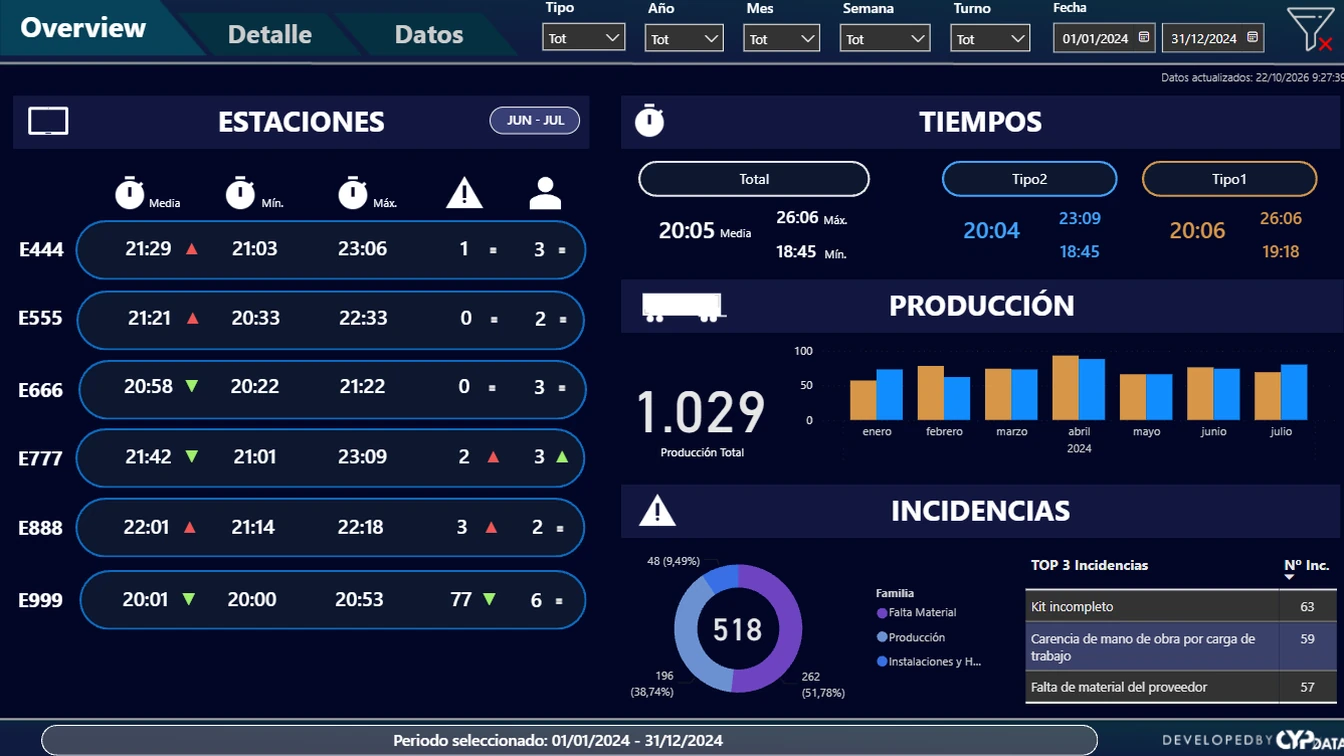
Each station’s times, production by month and incidents by family, on one screen.
Production and times
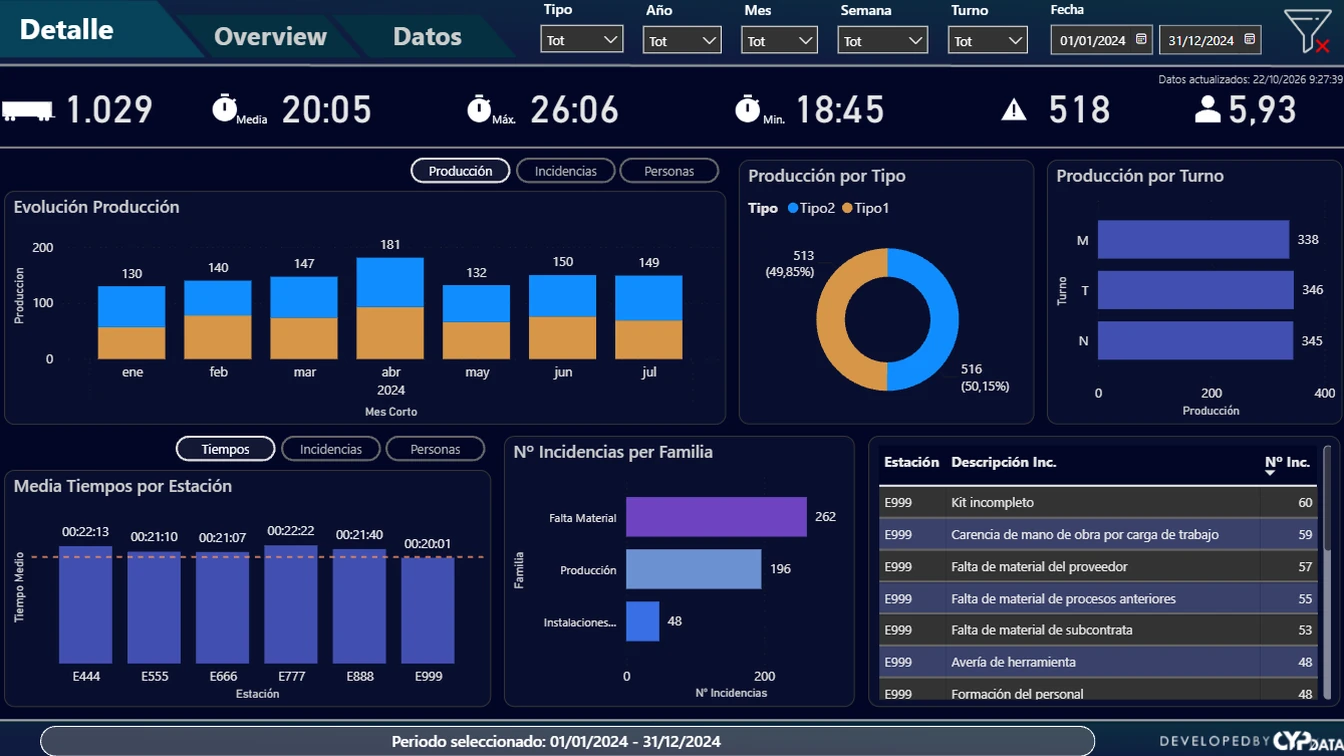
Production by month, type and shift, and each station’s average time against the line’s.
Every visit, one by one
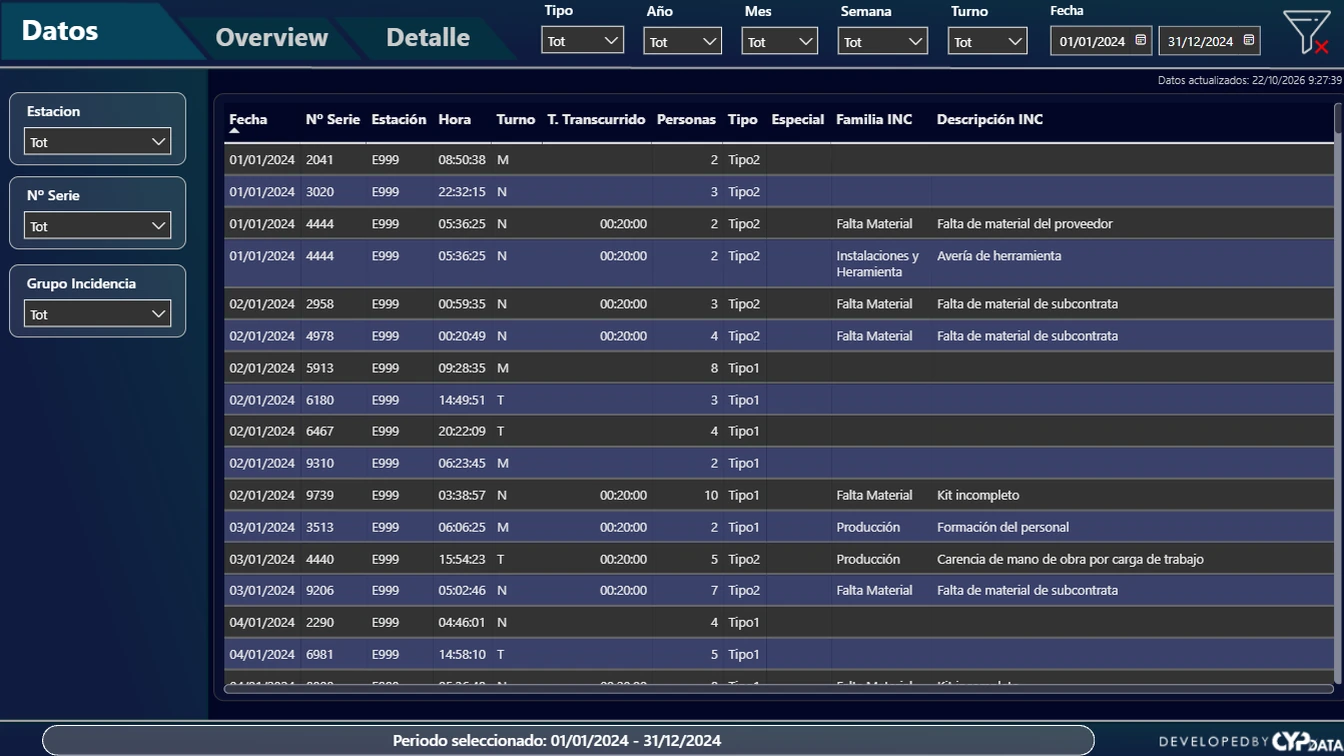
Every station visit with its serial number, shift, people and incident, filterable by date.
How it fits
The server sends the missions to the maker’s fleet manager, emails incidents and diagnostics, and stores the data in Azure SQL.
A similar project? Let’s talk.
You hear back from the team that does that work: CYP ENGY, CYP DATA or CYP SIRE.