





From Simulation to Reality
CYP SIRE: process simulation, layout and digital twin
We model your line or your plant with its real variability and test every decision before you invest in it.
- Speciality
- Simulation, layout and digital twin
- Tools
- AnyLogic · Python · Excel
- Published cases
- Published cases: 3
- Sectors
- Automotive
Test a line’s supply before you build it.
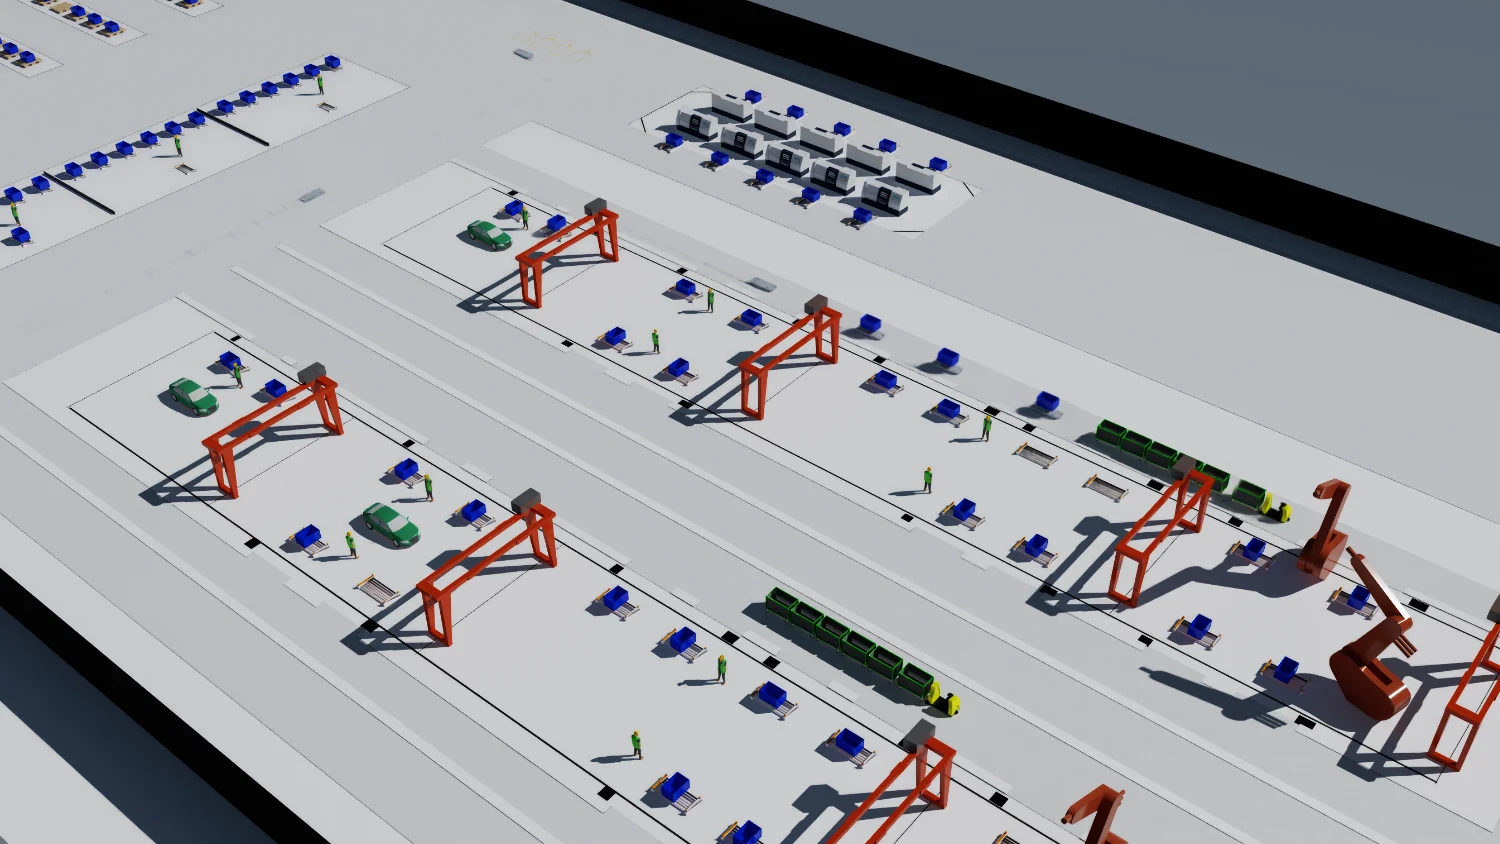
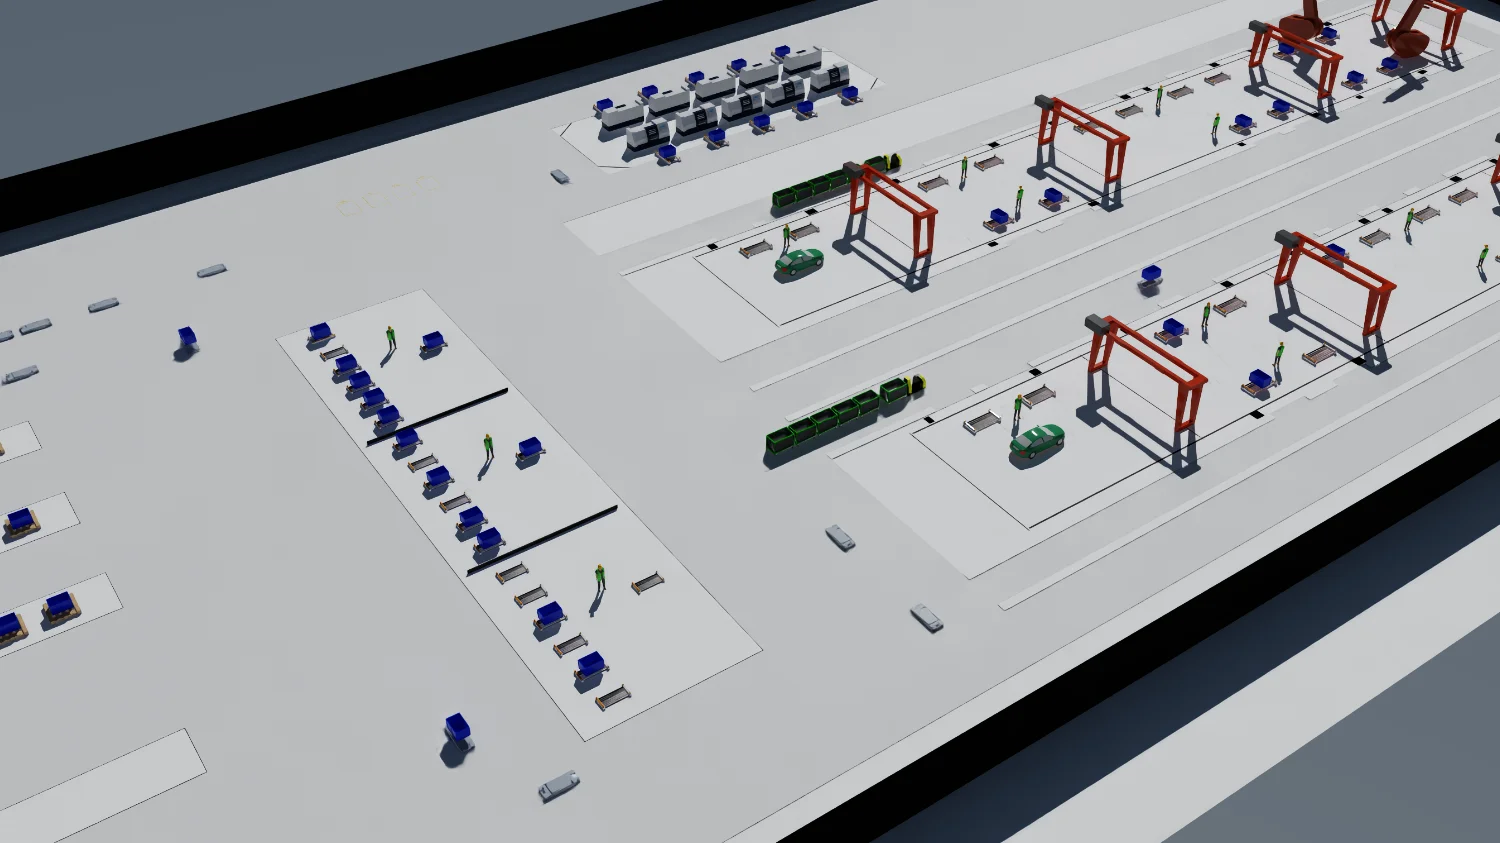
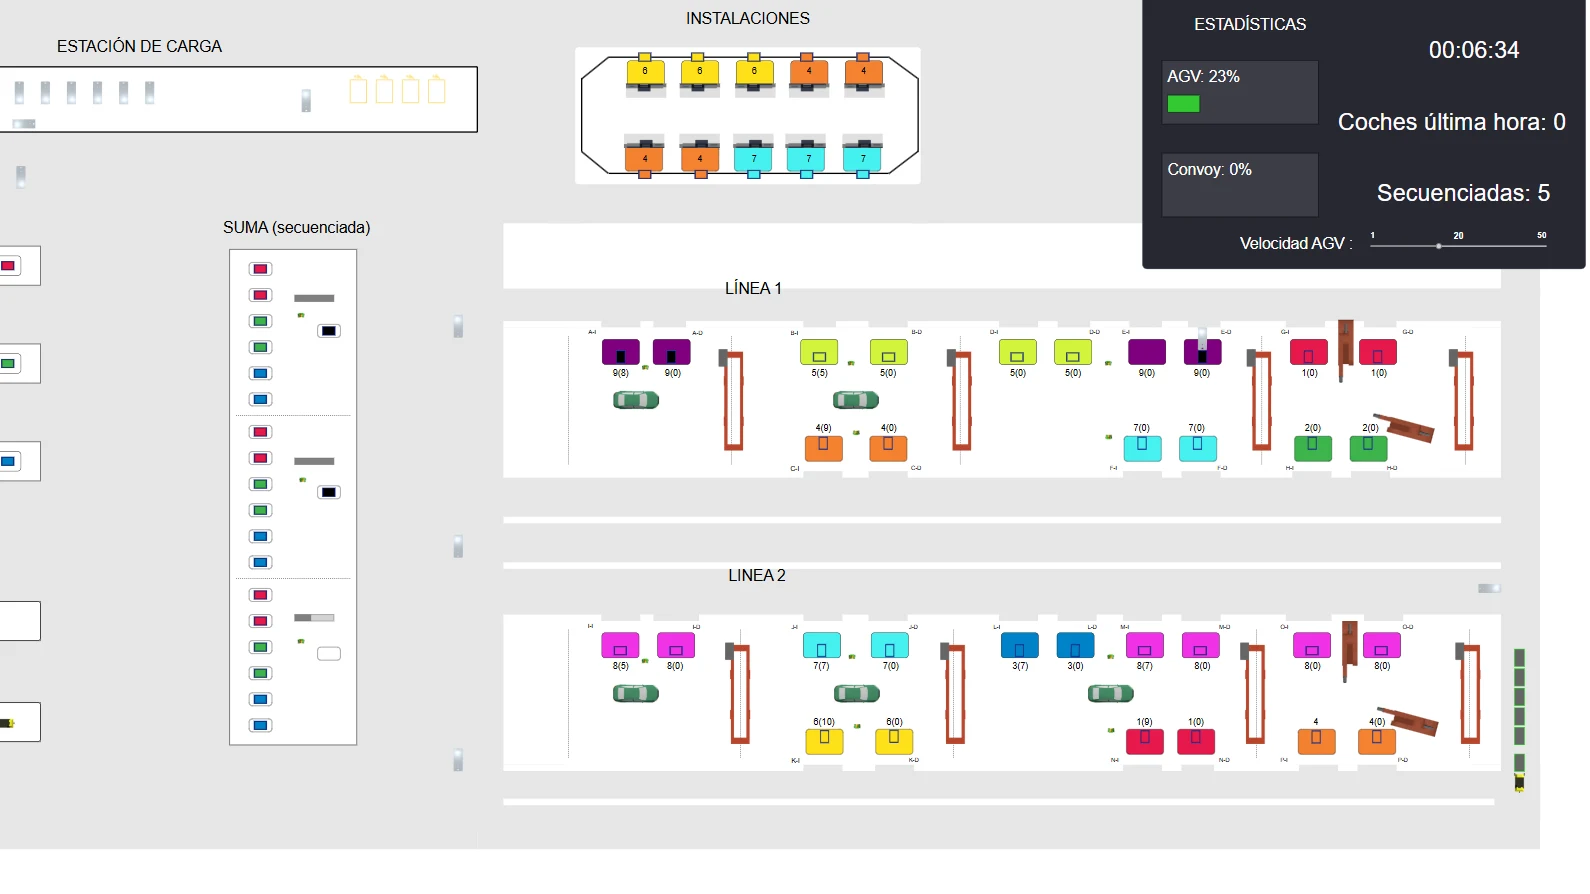
A CYP SIRE model, rebuilt for the browser: two assembly lines supplied by AGVs and trains. Open it to walk through it step by step, or change the fleet, the rhythm or a street and compare.
To compare scenarios and find the bottlenecks of the material flow before they reach the real plant.
How it works
-
The plant
Two assembly lines, and a fleet of AGVs and two trains that supply them.
-
The line consumes
Each part has two boxes at its station, L and R: while one is used, the other waits.
-
The request
An empty box calls for another by itself: the nearest free AGV brings it.
-
Installations
Each installation makes boxes of its part at its own rhythm.
-
Supermarket and kitting
Base parts leave the supermarket; kitting puts several into one box.
-
Trains
Some parts travel by train: one trip delivers several boxes.
-
Traffic
Each vehicle books its way before it leaves: no one collides and no one gets stuck.
-
Batteries
The AGVs watch their battery and go to charge by themselves.
Every parameter is loaded from an Excel file: the scenario changes without touching the program.
The original model, in AnyLogic
The simulation above is rebuilt for the browser from this CYP SIRE model in AnyLogic.
The average says it fits.
Eight trucks a shift, 45 minutes to unload each and one dock: on average, everything fits. Try it in four steps.
01 The average
One truck an hour and 45 minutes to unload each: the dock works 75 % of the shift and finishes at 14:45. Everything fits.
02 A real day
The same eight trucks, as they really arrive: some early, some late and, after a hold-up on the road, several at once. They wait, and the last unload ends after 15:00.
03 A thousand days
A thousand shifts with the same average. On 17 days in 100, the last unload ends after the shift.
04 The decision
A second dock takes 10 days in 100 off the late list; a third, 2 more: the rest are trucks that arrive late, and another dock does not fix that. What does a day after the shift cost you, and what does a dock cost? That is the decision, and a model answers it, not an average.
Decisions tested before they were made.
What we are asked before an investment, what we model to answer it and where we have done it.
What do you need to decide?
How many AGVs does it really need?
- What we model
- The fleet and the layout’s buffer, over thousands of scenarios with the plant’s variability, not one average day.
- What comes out
-
- Chance of failure for each fleet size
- Fleet occupancy
- Buffer needed
- Service
- Stochastic simulation
Will the traffic fit the crossing we are about to build?
- What we model
- The vehicles that cross a logistics bridge and meet in a narrow delivery area, before the works.
- What comes out
-
- Chance that two vehicles meet
- Waits in the delivery area
- Saturation of the crossing
- Where we did it
- AGV traffic on a logistics bridge, studied before construction
- Service
- Stochastic simulation
Can the line take an abrupt change of programme?
- What we model
- The lines, with their stoppages, facing changes of production from one day to the next.
- What comes out
-
- Response of the lines, with their stoppages
- Bottleneck
- Nominal capacity and resources
- Where we did it
- Battery lines simulated against sudden production changes
At the same plant: the planning process and the resources it needs.
- Service
- Process engineering
How many docks do the shift’s trucks need?
- What we model
- The trucks arriving as they really arrive, the unloading process and its resources, over several scenarios.
- What comes out
-
- Waits and unloads after the shift
- Resources needed
- Cost of a stoppage
- Where we did it
- The example in The average
- Service
- Layout optimization
Does every box reach the line in time?
- What we model
- The whole line supply: AGVs, trains, supermarket and kitting, with their streets, crossings and batteries.
- What comes out
-
- Cars per hour against the target
- Minutes of line stoppage per shift
- Saturation of aisles and crossings
- Fleet needed
- Where we did it
- The model on this page
In another workshop: the saturation of aisles and critical points, and three future scenarios.
- Service
- Layout optimization
Services Stochastic simulation Digital twins Process engineering Layout optimization All CYP SIRE cases
First the model, then the investment.
The model is validated before it is used, and the decision comes with its scenarios, not with an average.
-
What you bring
-
We build the model of the facility with its real times, routes and rules, and validate it against current operations.
What you bring: The plant’s layout, in DWG, DXF or PDF; Cycle times and takts; Routes, shifts and the rules of the operation. What you take away: The model, which you can run yourself; Its parameters in an Excel file you change without touching the program. -
We run scenarios with real variability (demand, breakdowns, fleet, priorities) until we find the saturation point.
What you bring: Volumes and product mix. What you take away: The scenario report, with the recommendation. -
We present the configuration that meets the target with the lowest investment, with heat maps and recommendations.
What you take away: The scenario report, with the recommendation; In some projects, a panel with all the results. -
What you take away
- The model, which you can run yourself.
- Its parameters in an Excel file you change without touching the program.
- The scenario report, with the recommendation.
- In some projects, a panel with all the results.
You don’t need all of it: we work out what is missing with you.
Ask for a studyBefore we start
How do we know the model is right?
Before we use it, we validate it against current operations: it has to reproduce what already happens in your plant before it says what would happen.
Can we use the model afterwards?
Yes: we hand the model over for you to run, and its parameters live in an Excel file.
And once the plant is running?
Then we are talking about a digital twin: a simulation model that runs on the plant’s real-time data, works out what should be happening and compares it with what is happening.
Tell us about your line.
Which decision you want to test before investing: fleet, capacity or layout. A CYP SIRE engineer reviews your case.