





A forklift fleet across automotive plants, brought together every day in one source
A platform that collects a forklift fleet’s data from automotive plants every day, checks it and brings it together for seven reports.
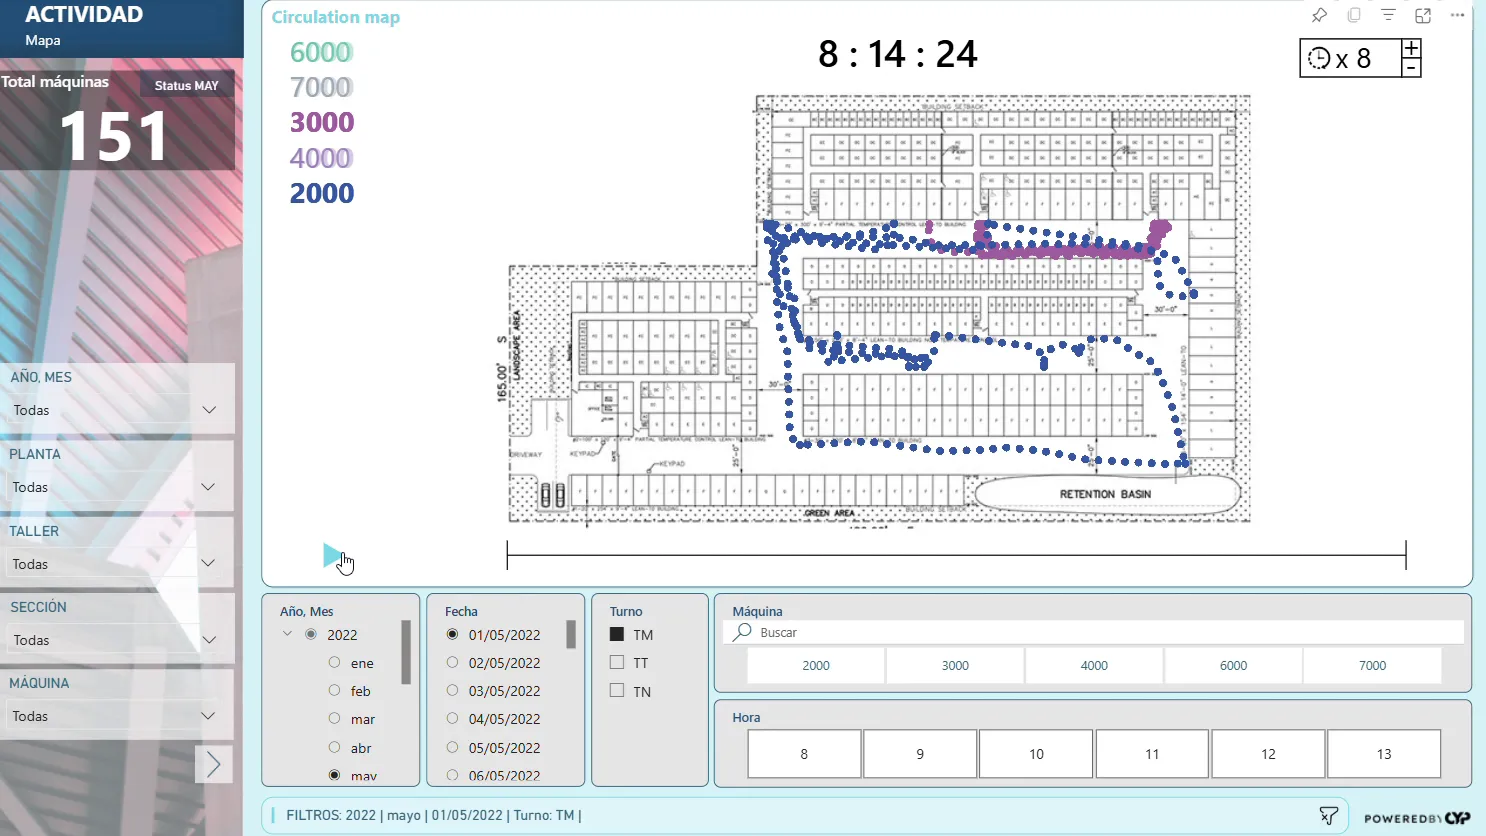
- 0.0 s · Two machines’ routes over the morning, each in its colour, on the plan.
- 1.7 s · You press play: the plan clears and the clock starts at 8:14, at eight times its speed.
- 3.0 s · Each machine moves point by point along the aisles until 8:22.
- Client
- MOVVO (Excens group)
- Sector
- Automotive
- Status
- In production since 2021
- Platforms
- Web
- Services
- Custom web platforms
The result
- The data arrives by itself every day, with no exports and no Excel
- If a load fails, the team knows before anyone else
- Adding a plant, a source or a report is set-up, not a rebuild
- +900 forklifts on the platform MOVVO (Excens group) Project sheet, CYP DATA, 2026
- +6 automotive plants MOVVO (Excens group) Project sheet, CYP DATA, 2026
- ≈24 h saved every week (estimate) MOVVO (Excens group) Project sheet, CYP DATA, 2026
- 7 reports, from each forklift to management MOVVO (Excens group) Project sheet, CYP DATA, 2026
The challenge
Bring a fleet’s data together every day, with no manual work, from three systems with no link between them.
- Three unconnected sources: the fleet software, the A3 ERP and SharePoint
- No access to the forklift maker’s API
- Every report was built by hand, in Excel, plant by plant
How it works
-
We collect
Every day, with no one involved, even though the fleet software has no API: its exports arrive by email and are picked up automatically.
- Azure Logic Apps
- Azure Data Factory
-
We clean and check
Each file is sorted and passes its quality checks. If anything fails, the team gets an email with the error.
- Python
- SQL Server
-
We unify
Everything loads by itself into a single cloud data warehouse, with a data mart per business area: one source for the whole fleet.
- AWS S3
- Snowflake
-
We show
Seven reports, from each forklift to the management view, with a heat map and an animated GPS route we built to measure.
- Power BI
The fleet’s reports
The seven Power BI reports we built on a star model read from the data warehouse, from each forklift to the management view.
Fleet: arrivals and departures
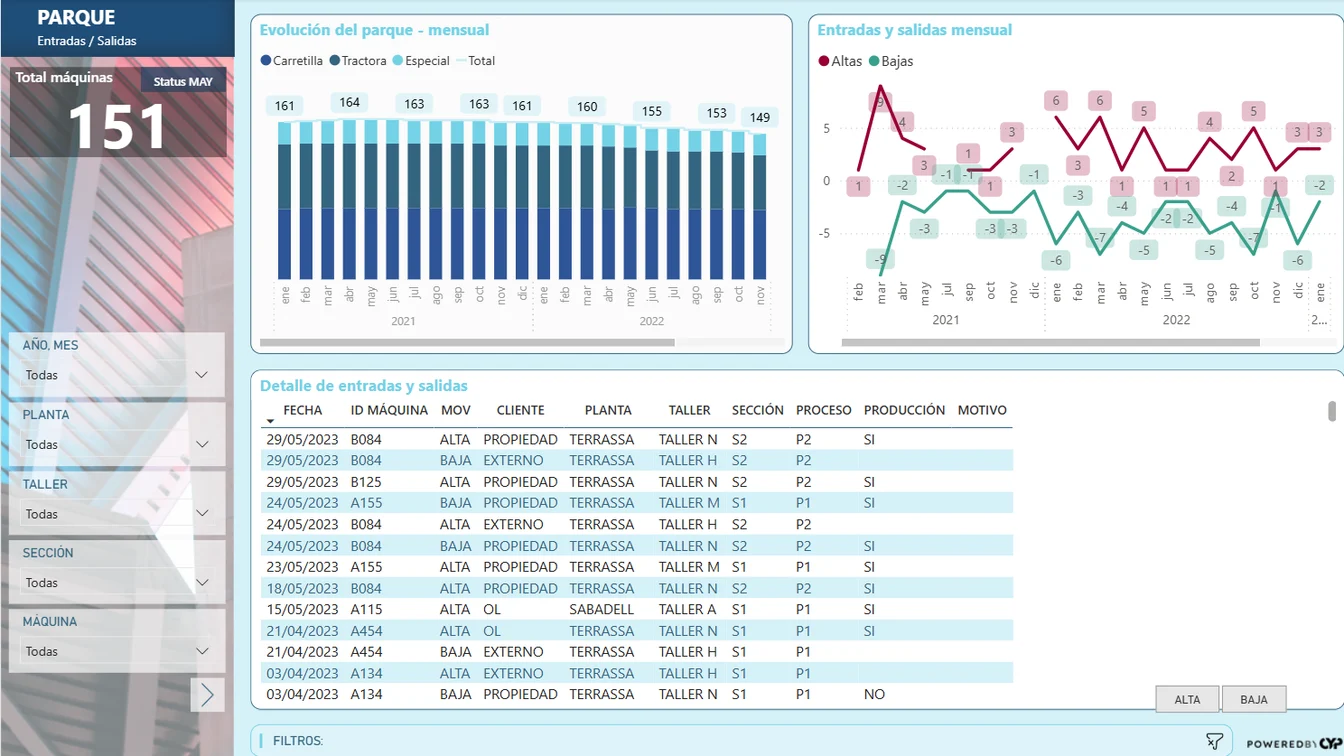
The machines of each type month by month, and each arrival or departure with its plant, workshop and section.
Each machine’s activity
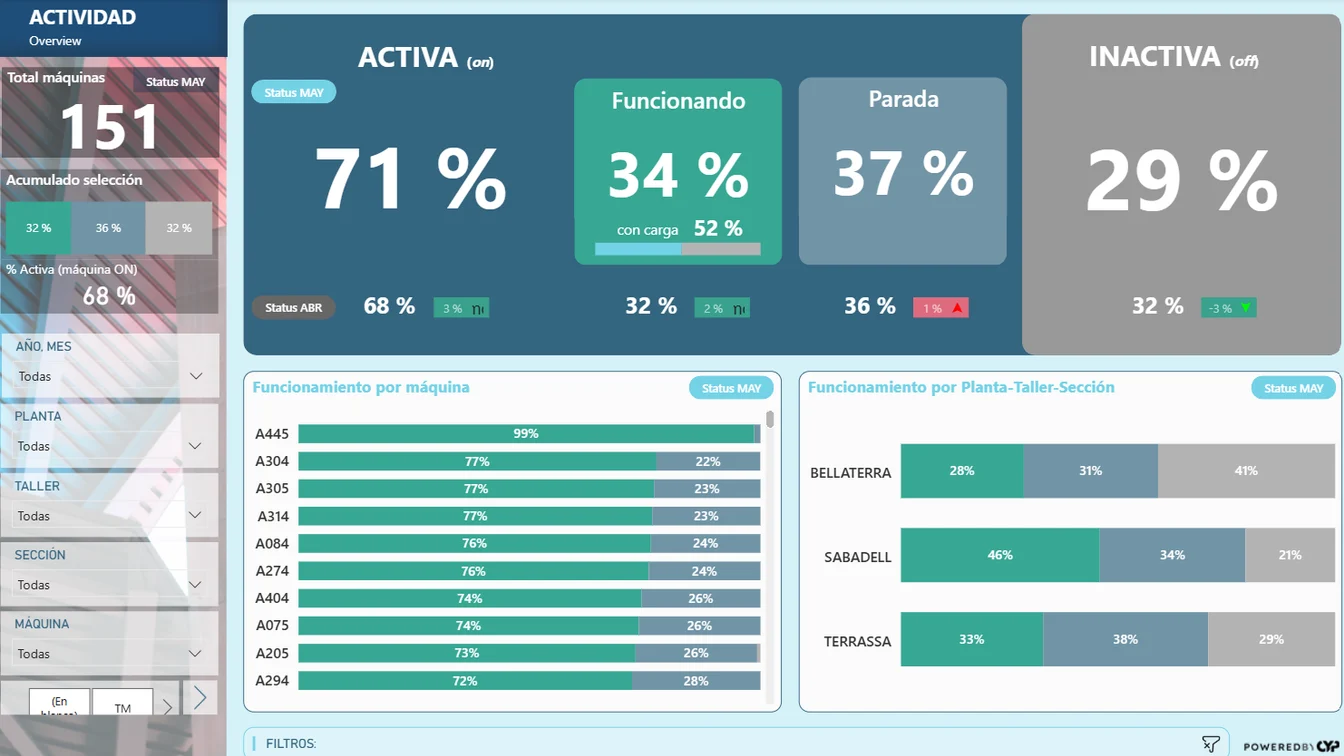
How much of the time each machine is on, working or stopped, machine by machine and plant by plant.
Route heat map
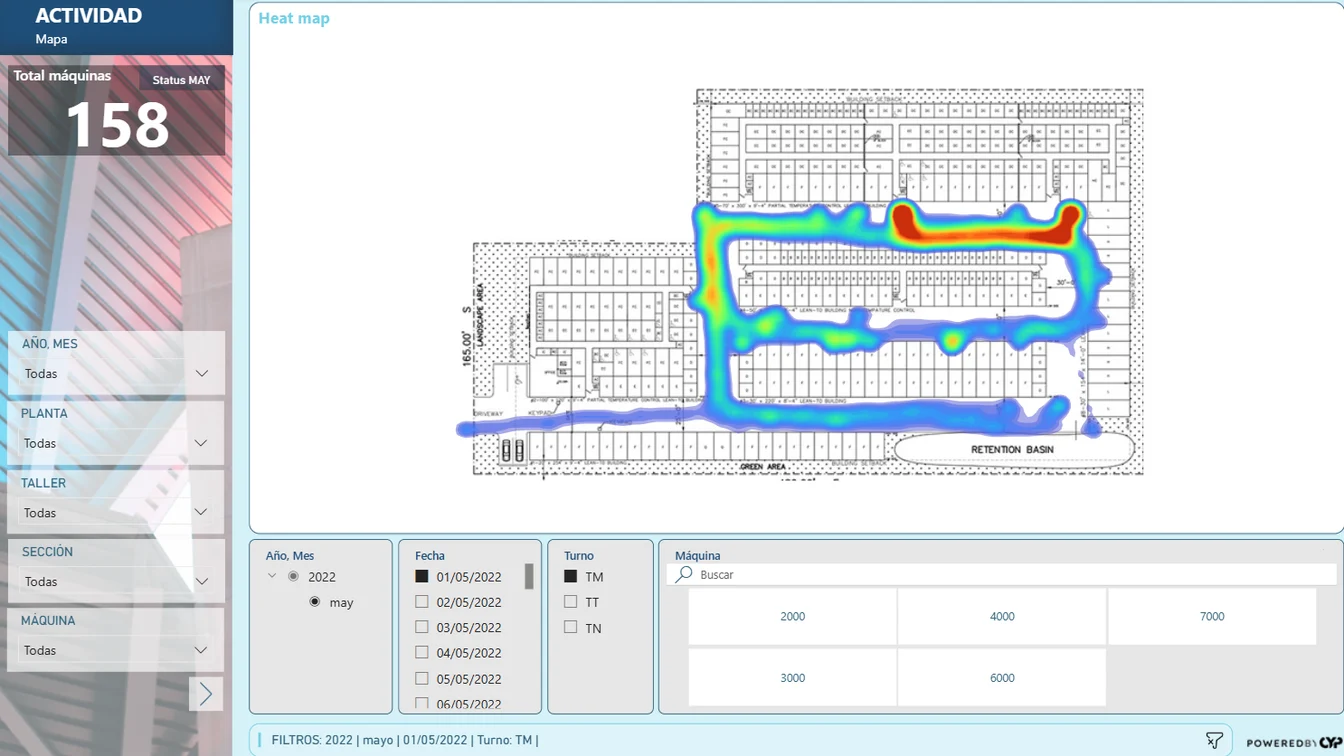
A visual we built: where the machines go most in a day and a shift.
How it fits
It reads the fleet software, the A3 ERP and SharePoint, and puts it all in Snowflake.
A similar project? Let’s talk.
You hear back from the team that does that work: CYP ENGY, CYP DATA or CYP SIRE.